Technical and Commercial Telecom Analytics

Introduce Holistic Interconnect Decision-Making
Traditional telecom analytics separates technical performance monitoring (ASR, quality) from commercial analysis (cost, revenue), creating dangerous blind spots. When you offer attractive pricing but deliver poor quality, neither network nor commercial teams have unified data to evaluate the true business impact. Margin compression and customer churn are often overlooked, resulting in doubled retry attempts and lost revenue that negate any cost savings.
Heksagon’s unified analytics platform lets you process technical and commercial data together in near real-time (with 15-minute refresh intervals). The system automatically correlates CDRs with routing decisions, pricing data, quality metrics, and financial outcomes, enabling analysis that answers critical business questions: which carriers deliver the optimal cost-quality balance, where margin compression risks exist, and which commitment strategies maximize returns. This gives you actionable insights hours after events occur, instead of weeks later through manual reporting.
Heksagon Telecom Analytics Features
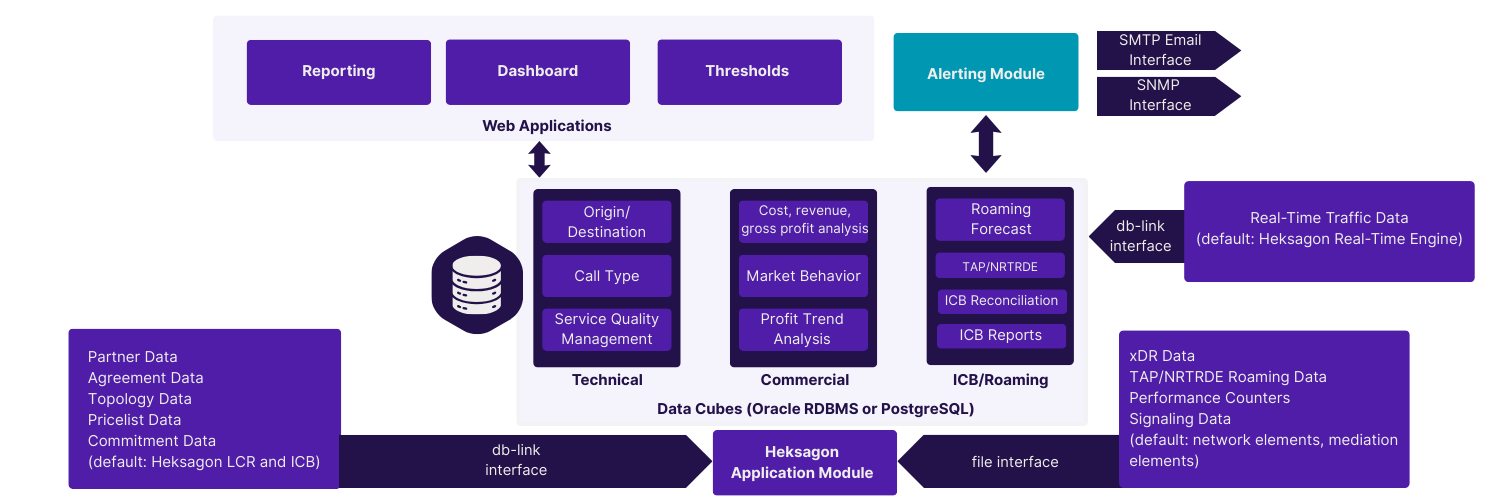
Our comprehensive analytics platform combines powerful OLAP analysis capabilities with telecom-specific data domains. It delivers both technical depth and commercial insight within a single unified interface.
Data Foundation & Processing
- Multi-Source CDR Ingestion: Collect and unify call records from switches, mediation, and quality control systems via FTP/SFTP, API, or database links.
- Intelligent Data Enrichment: Normalize diverse CDR formats and correlate records from multiple sources, enriching them instantly with active pricing, carrier ID, and network topology details.
- Near Real-Time Aggregation: Process data with 15-minute refresh intervals and automatically calculate essential quality metrics (ASR, NER, ACD, PDD) based on call progress parameters.
Core Performance & Traffic Analytics
Carrier Quality Tracking: Monitor ASR, NER, ACD, and PDD metrics across carrier, destination, and trunk group, including historical trending and threshold alerting.
Routing & Load Analysis: Evaluate traffic distribution, carrier selection effectiveness, and analyze channel utilization patterns on short intervals to proactively identify capacity constraints and saturation risks.
Quality Degradation Detection: Identify carriers or destinations experiencing declining metrics before thresholds are breached, using predictive trend analysis.
Commercial Insight & Margin Management
- Call-Level Margin Analysis: Match incoming and outgoing traffic at the CDR level to calculate exact profit margins per transaction, analyzing profitability by carrier, customer, product, and time period.
- Commitment Tracking & Risk: Monitor volume agreement fulfillment status, project completion dates, and identify over- or under-delivery risks to maximize returns on committed traffic.
- Margin Risk Detection: Automatically flag destinations or carriers where selling prices fall below termination costs (negative margin detection), triggering immediate review and routing adjustments.
- Advanced OLAP Framework: Utilize drag-and-drop report creation with unlimited drill-down depth, flexible slicing/dicing, and custom formula building for ad-hoc analysis and comparison against historical trends.
How Heksagon Telecom Analytics Works
Our analytics platform operates as a comprehensive data processing and analysis engine that transforms raw CDRs into actionable business intelligence. The system continuously collects, processes, enriches, and aggregates data while providing instant access to historical and near real-time insights through flexible reporting interfaces.
Data Collection & Processing Pipeline
- Our platform continuously collects Call Detail Records (CDRs) from network elements at configurable intervals (typically 5–15 minutes). Each file undergoes integrity checks for completeness and consistency before processing. Interconnect-relevant records are filtered and normalized into a unified format, capturing key parameters such as A/B numbers, timestamps, duration, disconnect cause, trunk identifiers, and service type.
- Duplicate records from multiple switches are correlated and merged to ensure accuracy. Data is enriched with topology, pricing, and quality metrics, then rated against purchase and selling price lists, applying discounts and time-based rules where applicable. Finally, traffic is aggregated into analytical cubes across dimensions like carrier, destination, time, and product. This enables drill-down from high-level summaries to individual call details.
Near Real-Time Analytics & Alerts
- Processed data is available for reporting within 15–20 minutes of call completion, delivering near real-time visibility compared to traditional monthly cycles. Continuous threshold monitoring detects anomalies such as ASR degradation, margin compression, or commitment deviations. Alerts are triggered via email or SNMP with configurable severity levels and escalation paths.
- Interactive dashboards consolidate KPIs on a single screen with auto-refresh and drill-down capabilities, giving operations and management teams instant insight into network performance and commercial health.
Integration & Data Export
The analytics engine integrates seamlessly with routing, billing, and optimization modules, creating a closed-loop system where insights directly inform operational decisions. Flexible export options include scheduled reports (Excel/PDF), APIs for programmatic access, database views for BI tools, and CSV/XML for data warehouses, supporting custom formats for regulatory or executive reporting.
Didn't Find What You Were Looking For?
Frequently Asked Questions
How quickly is data available for analysis after calls complete?
Data is typically available within 15–20 minutes post-call in environments with reliable CDR delivery. Default refresh intervals are 15 minutes, but configurable delays (up to 1 hour) accommodate networks with inconsistent data flow.
Can the platform handle billions of records monthly?
Yes. Deployments routinely process 12+ billion records per month without performance degradation. Optimized architecture and pre-aggregated dimensions ensure instant reporting and scalability without redesign.
What makes OLAP analytics different from SQL reporting?
OLAP supports multidimensional, ad-hoc analysis pivoting dimensions, drilling down to individual records, and slicing across multiple combinations, all without predefined queries. SQL reporting is static and scenario-specific; OLAP is dynamic and exploratory.
How does margin analysis work with unmatched traffic?
Profit estimation algorithms apply routing logic, historical patterns, or default assumptions when direct matching fails. Reports clearly flag estimated vs. calculated margins for transparency.
Can analytics pinpoint calls causing quality or margin issues?
Yes. Unlimited drill-down lets users trace from KPIs to individual CDRs, analyzing disconnect causes, trunk groups, pricing, and routing decisions for root-cause identification.
What threshold alert options are available?
Alerts can be set on any metric with configurable severity levels (Warning, Minor, Major, Critical). The available notification methods are via email or SNMP support escalation paths and multiple thresholds per metric (e.g., ASR warning at 55%, critical at 45%).
Let's Get in Touch!
Interested in our Technical and Commercial Telecom Analytics solution? Fill out the form and our solution experts will contact you in two business days!